
The transition from the first to the second quarter of the year is historically a pivotal period for mobile app monetization. Following the predictable post-holiday budget contractions of Q1, Q2 typically introduces a vital reset in advertiser spend and renewed competition across bidding networks and SSPs. Tracking and understanding such market shifts is the core objective of our ongoing eCPM series, which we have been consistently publishing since early 2024. To better understand the shift from the post-holiday drop to next quarter’s rebound, we recommend reading our prior analysis that breaks down the Q4-to-Q1 eCPM plunge.
Mobile apps eCPM performance Q2 2026 vs Q1 2026
How did mobile app eCPMs fare between the first two quarters of 2026? To answer this, we gathered billions of impressions from the Bidlogic network into a single dataset to build two comprehensive maps. Below, you’ll find the percentage changes for Android and iOS across five global markets (the USA, UK, Germany, India, and Japan), specifically focusing on Interstitial, Banner, and Rewarded Video ad formats:
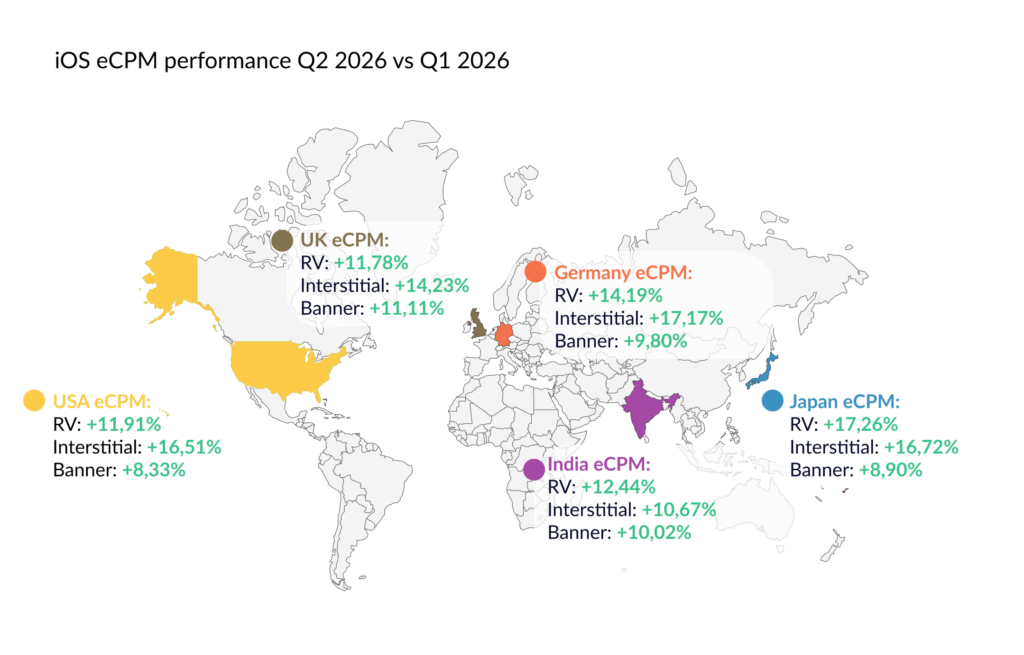
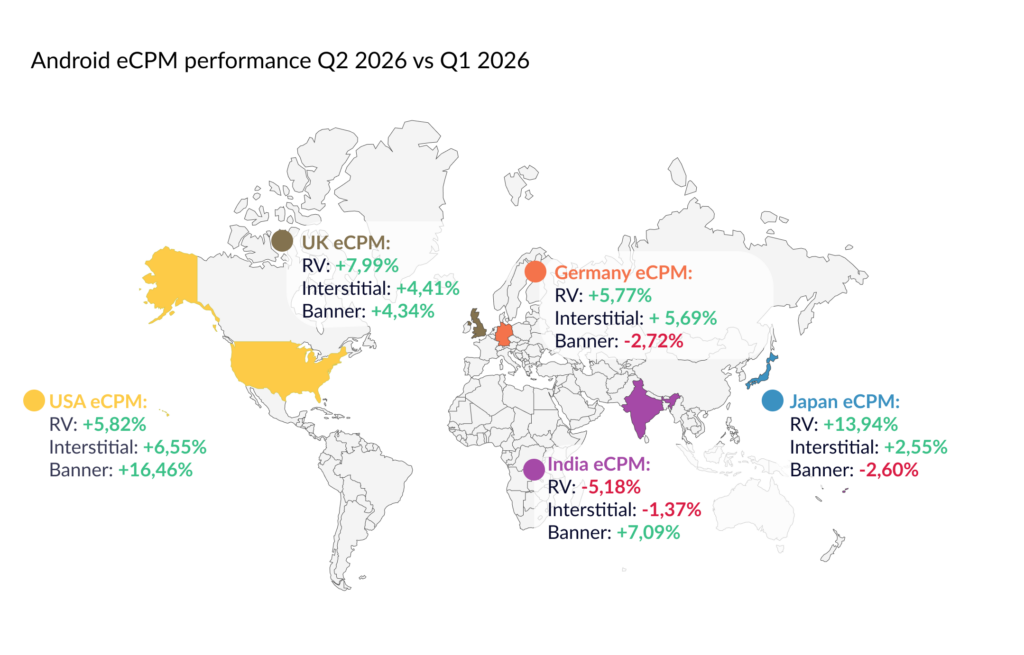
The data presented above indicates a strong, general upward trend in eCPM performance, largely fueled by robust, mostly double-digit growth across the entire iOS ecosystem. Among all ad formats, iOS Interstitials and Rewarded Video delivered the most impressive yield gains globally. In contrast, Android inventory presented a more fragmented and subdued landscape. While the USA experienced an exceptional spike in Android Banners, India saw the most visible market correction, recording single-digit declines in both Android Rewarded Video and Interstitials.
Zooming in on Apple’s ecosystem, across all ad types and target areas, yield growth never fell below 8%, showing strong advertiser trust and steady demand. Notably, 12 of 15 data points showed strong double-digit increases, with both India and the UK registering such growth. This upward momentum reached its zenith with 17.26% surge in Japan (Rewarded Video), the highest gain in the whole analysis. Interstitials stood out as the best-performing format in this iOS category, ranging from 10.67% to 16.72%. This underscores the strong demand for full-screen inventory.
Meanwhile, Android showed a more mixed picture. Rewarded Video and Interstitials have emerged as strong and stable ad formats across developed regions, with increases ranging from 2.55% to 13.94%. On the other hand, Banners can be described as a highly divergent ad format, particularly in Germany and Japan, where mild drops of 2.72% and 2.60% were recorded. Within this category, the US registered the highest increase across the Android dataset: 16.46%. At the same time, India ranked as the poorest performer in the Android category, with declines in two ad types: Rewarded Video and Interstitials, respectively, -5.18% and -1.37%.
Bidlogic’s algorithmic precision
Bidlogic’s algorithms process millions of daily impressions, continuously learning and adapting to your app’s unique performance nuances. To mitigate market fluctuations, without the burden of manual adjustments, our technology automatically constructs and manages dozens of granular waterfalls alongside precise eCPM bid floors across top bidding networks. Ultimately, this translates to thousands of automated optimizations executed every week – calibrating your ad stack to capture the highest possible yield and maximize your overall revenue.