
As we continue our series of articles reviewing eCPM (Effective Cost Per Mille) performance in mobile apps across different regions, platforms, and ad formats within the Bidlogic network, we once again examine the transition from Q4 to Q1. This time, we are focusing on the comparison of the last quarter of 2024 with the first quarter of 2025. To gain a broader perspective, we encourage you to read the comparison between Q2 and Q3 2024.
Mobile apps eCPM performance Q1 2025 vs Q4 2024
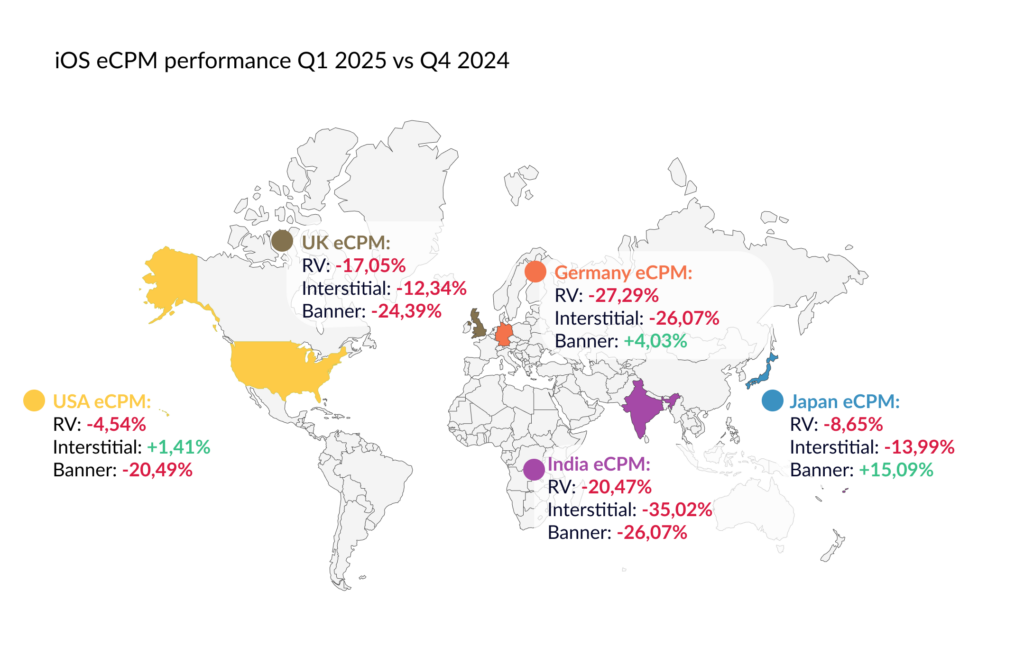
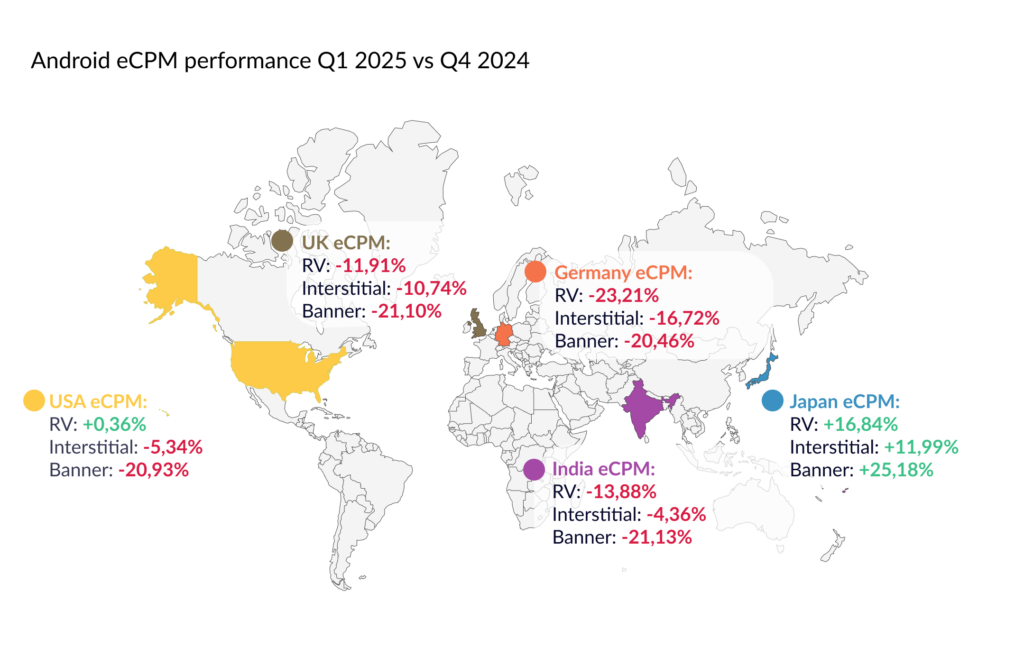
As in previous articles, we’ve analyzed eCPM trends across Rewarded Video, Interstitial, and Banner formats for both iOS and Android in Bidlogic’s mobile app network. Below, you will find two maps outlining the percentage of eCPM changes that occurred in the USA, Germany, the United Kingdom, Japan, and India:
The latest analysis of eCPM performance across the Bidlogic network reveals a clear downward trend. It indicates recurring seasonal patterns while also revealing several market-specific anomalies worth noting.
When it comes to iOS Interstitials, India recorded the steepest drop in the whole study – 35,02%. The United States was the only country to register an increase in this category, with a growth of 1,41%. iOS Rewarded Video formats noted a uniform decline across all countries, with none showing growth, and declines ranging from -4,54% to -27,29%. Among all studied ad formats, Banners showed the most inconsistent results. While Germany and Japan saw growth (+4,03% and +15,09%, respectively), other regions – the USA, UK, and India recorded steep declines, ranging from -20,49% to -26,07%.
Meanwhile, Android showed a more mixed picture. While many regions also faced declines, there were notable gains, particularly in Japan, which stood out as the best-performing country in the whole study, with no reported declines in the case of Android. The results for Rewarded Video were diverse, with Japan leading at a growth rate of 16,84% and the U.S. seeing a slight increase of 0,36%. In contrast, regions like Germany and India experienced significant declines of double digits. Interstitials followed a similar pattern: Japan achieved a robust growth of 11,99%, while other regions, including the U.S. and Germany, experienced declines from -4,36% to -16,72%. As for Banners on Android, Japan experienced strong growth (25,18%), while other countries faced steep drops of over -20%.
From stagnation to strategy: unlocking growth with data
While Japan proved to be a bright spot, the overall trend indicates a decline or stagnation in eCPMs, emphasizing the importance of regional optimization and diversified ad strategies. Q1 often serves as a reset period for mobile monetization, providing a valuable opportunity to experiment, gain insights, and make adjustments. Whether it’s shifting focus to higher-performing regions or rethinking underperforming ad formats, the path to optimization begins with data, and Bidlogic is here to support you at every step. Every app publisher we partner with gains access to a user-friendly dashboard that provides all the necessary data, where, most importantly, you can track your revenue growth with our assistance!