
Comparing Q2 and Q3 across 2024 and 2025 reveals a consistent, upward trend, highlighting a recurring pattern in eCPM (effective Cost Per Mille) performance. Uncovering insights like this is the goal of our series on eCPM trends, designed to help readers better understand seasonal variations within Bidlogic’s network. To explore the previous quarter’s performance, we recommend reading our analysis of Q2 versus Q1 2025. Additionally, if you are asking yourself a question, “What is eCPM?”, it’s worth taking a look at an optAd360 article explaining the difference between CPM and eCPM.
Mobile apps eCPM performance Q2 2025 vs Q3 2025
Based on Bidlogic ad network data, this article provides an overview of eCPM trends by ad format and platform. The analysis compares results across key markets – the USA, UK, Germany, India, and Japan, with particular attention to Rewarded Video, Interstitial, and Banner ads. The results are shown across two maps, one for iOS and one for Android:
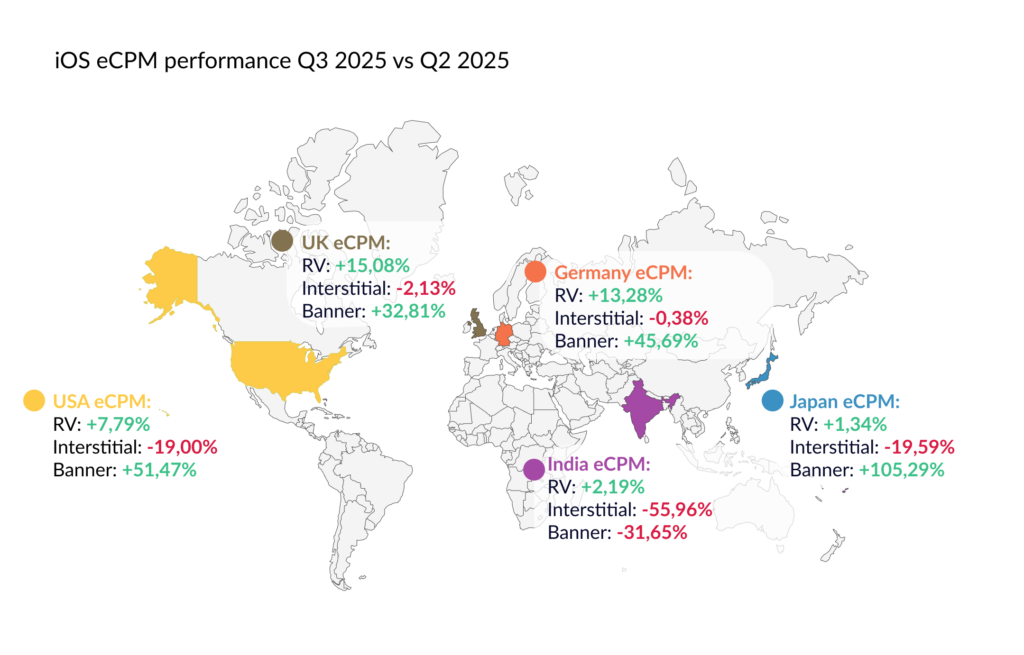
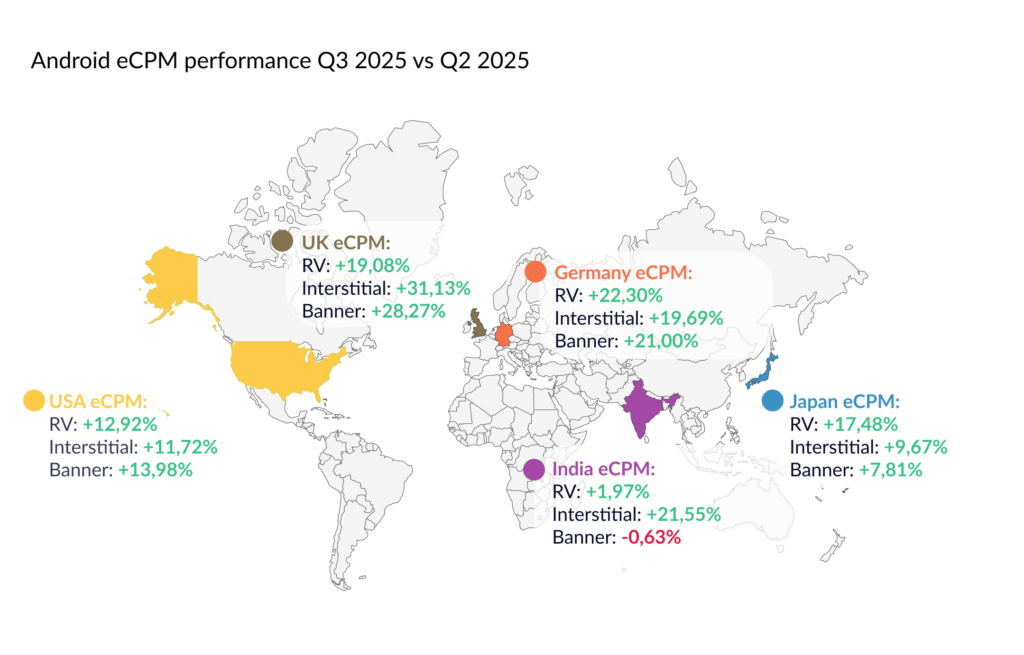
eCPM data for Android and iOS reveals a general upward trend. The only exceptions to this tendency were Interstitial ads on iOS, which showed no increases across any region, and Banner ads in India, where both Android and iOS recorded declines. In all other cases, eCPM values rose, confirming a generally positive performance across regions, formats, and platforms.
The variation in iOS eCPM results was substantial. The decreases ranged from approximately -56% to just -0.38%, whereas the increases spanned from slight improvements of +1.34% to a remarkable +105.29% in the case of Japanese Banner ads. It’s worth noting that it was the highest growth observed in the entire analysis. On iOS, Rewarded Video recorded steady growth across all regions, with the highest increase reaching +15.08%. However, it was Banner ads that demonstrated far stronger results, showing substantial gains in every region (except India with -31.65%), each exceeding +32.91%.
Compared to iOS, Android displayed smaller but still noteworthy eCPM shifts. They ranged from modest increases of +1.97% to as much as +31.13% for Interstitial ads in the UK. Although Banner ads in India recorded a small decrease (the only one in the Android group) of -0.63%, the drop was minimal and did not diminish the overall upward trend observed within this group.
Q3 2025 observations: isolated format variations
The underperformance of Interstitials on iOS in Q3 2025 appears to be a short-term anomaly, as the Bidlogic timeline reveals no consistent pattern like that. While such anomalies rarely alter the overall market picture, which is primarily positive in this case, tracking these shifts can help publishers anticipate potential opportunities or challenges. Regular monitoring ensures that small deviations are understood in context, rather than being mistaken for systemic trends.