
As July comes to a close, it’s a great moment to look back and assess the eCPM (effective Cost Per Mille) performance of mobile apps during the first half of the year compared to the second quarter. Interestingly, this is the fifth article in our series, which aims to provide mobile app developers with an analysis of how ad revenue for mobile apps is evolving over time. For additional context, you can revisit our analysis from the previous year, where we compared Q2 2024 to Q1 2024.
Mobile apps eCPM performance Q2 2025 vs Q1 2025
To illustrate the shift in mobile app eCPM performance between the first and second quarters of 2025, we’ve prepared two maps based on billions of impressions within Bidlogic’s network. They display percentage changes across five countries (the USA, UK, Germany, India, and Japan), covering three ad formats, Rewarded Video, Interstitial, and Banner, on both Android and iOS:
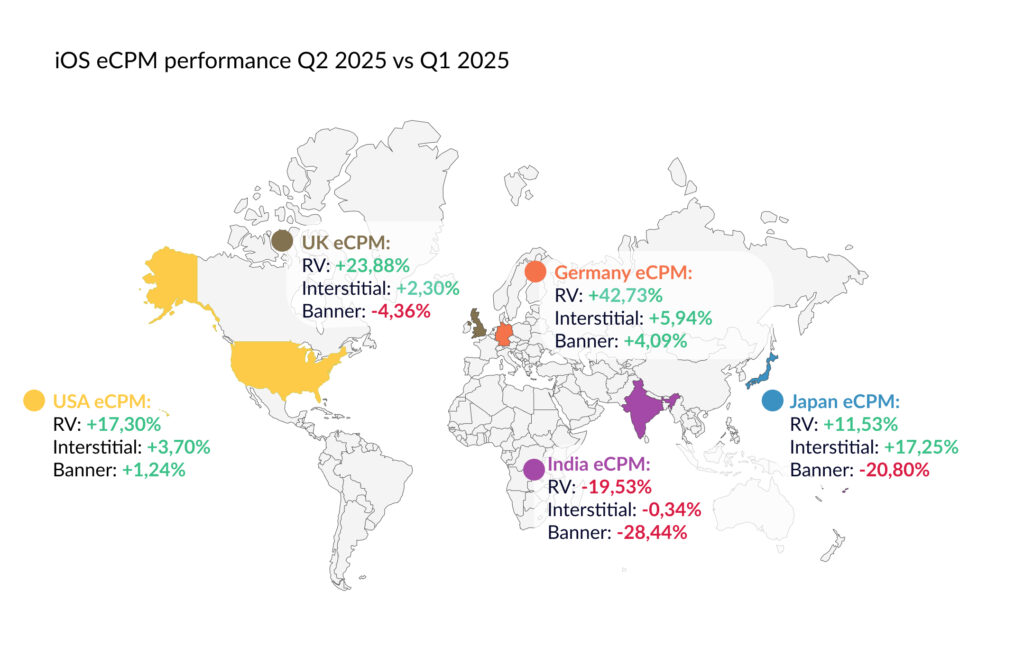
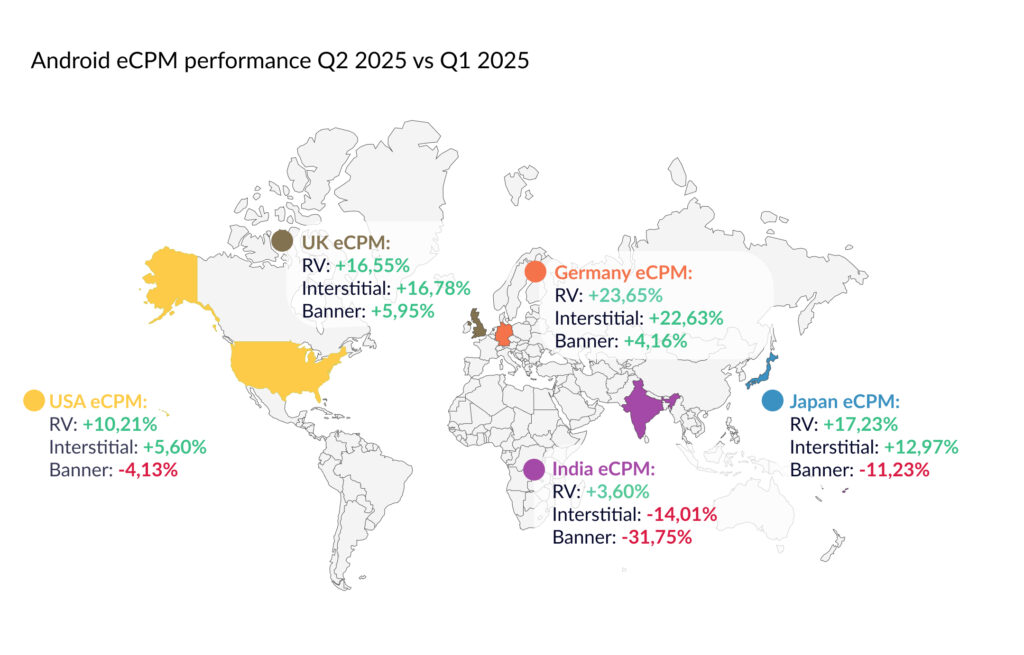
Overall, the data presented above indicate a general increase in eCPM performance in the second quarter of the year compared to the first. Among all countries analyzed, Germany stood out as the top-performing region, recording the most impressive growth across all ad formats and platforms, without a single decline. In contrast, India experienced the broadest decrease in eCPM, with only a minor exception in Android Rewarded Video.
As for iOS, Rewarded Video presents itself as a high-performing ad format, with 4 out of 5 countries showing positive performance. Germany, in particular, stood out with an impressive 42.73% increase, the highest among all countries analyzed. The statistics for Interstitial ads are similar to those for Rewarded Video: just like with Rewarded Video, India was the only country to record a decline, although a smaller one at -0.34%, compared to -19.53%. When it comes to Banner ads, the data suggest a continued shift away from that ad format, with three out of five countries showing a decline, including two with steep drops, surpassing 20%, in the cases of India and Japan.
For Android, Interstitials and Rewarded Video have emerged as strong and stable ad formats, with increases ranging from +3.60% to as much as 23.65%. On the other hand, Banners emerged as the weakest ad format, particularly in India and Japan, where the drops are notably steep. In this category, the most significant decline in the entire analysis was recorded, with a 31.75% drop in India’s case. Additionally, this country ranks as the poorest performer for Android ads overall, with declines in two ad types and only Rewarded Video showing minimal growth (+3.60%).
The importance of market-specific analysis
eCPMs in Q1 are generally impacted by a slowdown following the holiday season, with a significant decrease in advertisers’ spending after the hectic Q4. As a result, Q2 tends to look stronger by comparison, even when ad expenditure remains relatively moderate. However, although global trends provide useful context, analyzing each market or ad format individually is crucial to understanding the real drivers behind eCPM changes. For this reason, let’s take a closer look at the region that underperformed the most in the above-mentioned study – India. The lower eCPM levels in India can be attributed to the fiscal year ending in March and the school summer vacations in the second quarter of the year, resulting in reduced advertising activity. In contrast, Germany outperformed all other countries in the study, which suggests a well-balanced demand and effective ad placements. What is worth noting is that an upward trend occurred, despite the threat of increased US tariffs on German goods.
One of the most effective ways to counter seasonal trends and region-specific patterns is to optimize your advertising strategies while also analyzing data and acting accordingly. Bidlogic is a reliable monetization partner that helps with that. To increase your ad earnings, we automate the process of eCPM and bid instance management in major ad mediation systems. Don’t wait, and begin your journey towards more profitable monetization now!