
Keeping track of churn rate is crucial for mobile app publishers since it affects user retention, app ad revenue, and overall long-term success. User acquisition is only half the battle in the mobile app world; keeping users engaged is what truly defines long-term success. However, a poor ad experience can quickly turn a loyal user into an uninstallation statistic. What steps should app publishers take in this situation?
Mobile app churn rate
Mobile app churn is the metric that tracks the percentage of customers who discontinue using a mobile app in a specified period. In contrast, the app retention rate indicates the percentage of users who continue utilizing the app during that same timeframe. Analyzing churn rates over various periods can provide valuable insights into user behavior, retention patterns, and potential challenges. The choice of the time period the mobile app publishers want to use in calculations might depend on the app profile but also on other factors. Here’s a detailed explanation:
- A daily churn rate is most practical for app developers who take care of products with high-frequency usage, like productivity, finance, or communications apps, such as task or expense tracking apps or messaging applications. Additionally, you can choose to analyze daily churn to identify short-term engagement issues or, for instance, immediate reactions to ad placements;
- A weekly churn rate is recommended for apps that rely on weekly engagement patterns, like subscription-based content apps, such as streaming services offering shows and movies, or learning apps like those that teach languages. Additionally, monitoring churn at this level helps developers assess how advertising affects user engagement over time;
- A monthly or quarterly churn rate works best in the case of applications that rely on long-term user engagement, like shopping and e-commerce apps, but may also sometimes show seasonal engagement patterns and user retention over longer periods.
What’s more, app developers can also leverage cohort analysis to group users based on factors like language preference or the date when they installed the app. By tracking such a group, they can see where users lose interest and can fix the issue later.
How to calculate churn rate?
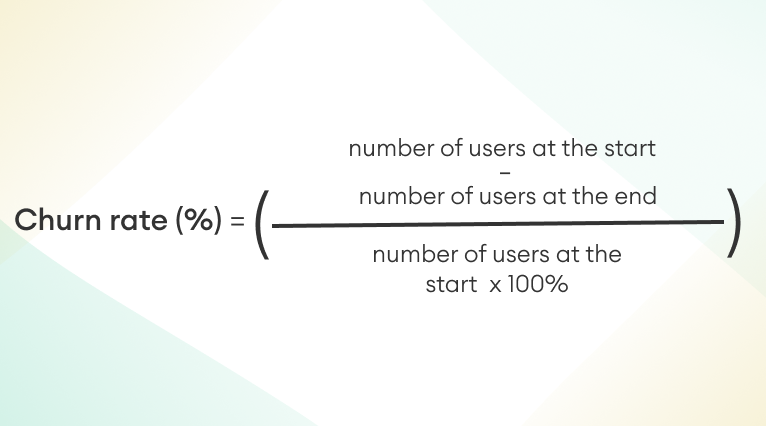
To calculate the percent of churn rate, you have to subtract the number of users at the end of a specific period from the total number of users at the start of that period and then divide the result by the number of users at the start of that period multiplied by 100%:
What is considered a “good” churn rate?
The fact is that some level of churn is inevitable; however, the key question is: what is considered acceptable, and what is the average? The average churn rate can vary based on many factors, like retention period (daily, weekly, monthly), type of app, platform, or even season. Regarding the average mobile app churn rate in different time frames, according to Business of Apps, the average day-one churn rate on iOS is 74,35%, and on Android, 76,99%. Day-thirty churn rate in the case of iOS drops to 95,87% and in the case of Android to 97,41%. Within the first three days of installation, the typical app loses 77% of its daily active users.
Ad-related user churn
Users may abandon the app for different reasons, such as disappointment with its features, fulfilling their initial purpose, or an unsatisfactory User Experience. Another factor leading to some departures is advertising, which can be grouped into:
- those caused by negative experiences with advertising,
- or the desire to install an application advertised within the application itself.
To address such issues, it’s crucial to use data and tools that can help find and eliminate poor advertising experiences. Additionally, working with reliable monetization partners is key. Through the use of analytics, user feedback, and ad monitoring tools, developers of mobile apps can identify ads or placements that might be contributing to user churn. Here’s a suggested approach:
- The first thing to do is to find a suitable in-app analytics tool that will help to track churn rates, session durations, drop-off points, and more. Solutions like Google Analytics for Firebase should help you identify ineffective ads that have high CTR and low revenue, or those with a high bounce rate and low earnings;
- In order to receive feedback from users about their ad-related disappointments, it’s worth implementing solutions like Instabug or UserVoice, but also simply reading app store reviews;
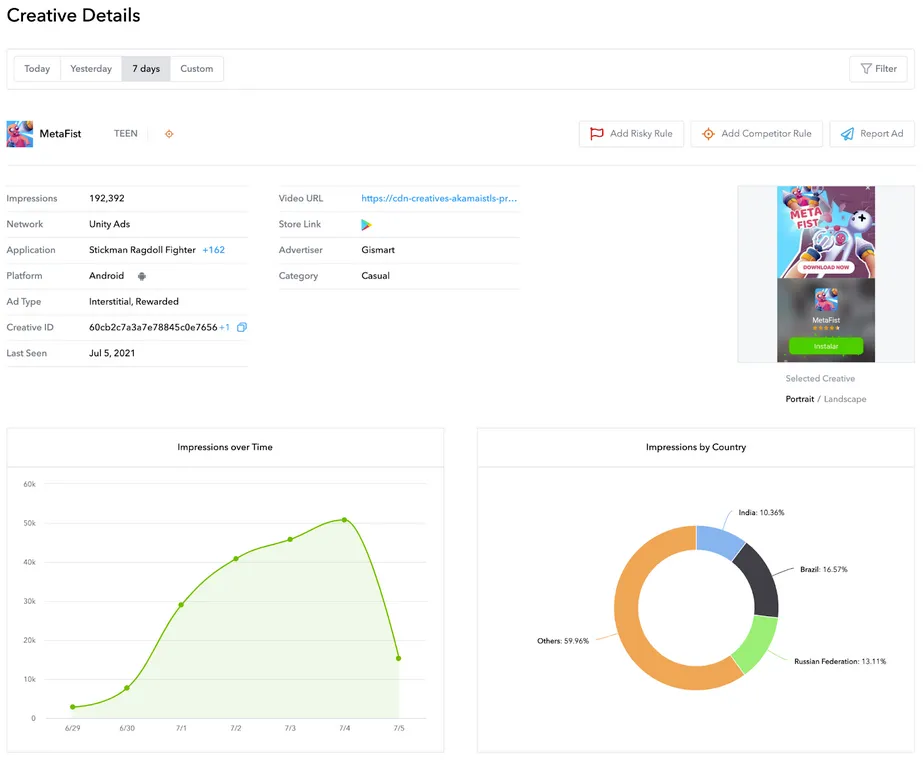
- Misleading or offensive ads might be causing user dissatisfaction. To prevent and detect them, you should implement ad monitoring tools, such as AppLovin Ad Review. Interestingly, this solution can also identify ads from competitors;
- Lastly, collaboration with trusted monetization partners, like Bidlogic, that ensure high-quality ads (while maximizing revenue) can prevent poor advertising experiences. Bidlogic provides app publishers with a comprehensive tool suite to optimize monetization strategies and maximize revenue potential. The company automates every step of managing eCPM and bidding instances, and you have access to a user-friendly dashboard that helps track key performance metrics and identify issues in ad performance.