
App advertising revenue fluctuations are substantial over the year, impacted by seasonal variations and shifts in user behavior. In Q1, publishers typically experience a decline as post-holiday expenditures diminish noticeably and businesses initiate new budget cycles. During Q2, the industry usually witnesses moderate growth due to the beginning of spring marketing campaigns and significant increases tied to holidays like Easter and Mother’s Day.
As a result, eCPM (effective Cost Per Mille) inevitably fluctuates, varying by region, ad format, and platform. This series of articles explores how eCPM values change in response to these factors within our network. If you haven’t already, you can also get familiar with our article comparing eCPM performance in mobile apps between Q1 2024 and Q4 2023.
Mobile apps eCPM performance Q2 2024 vs Q1 2024
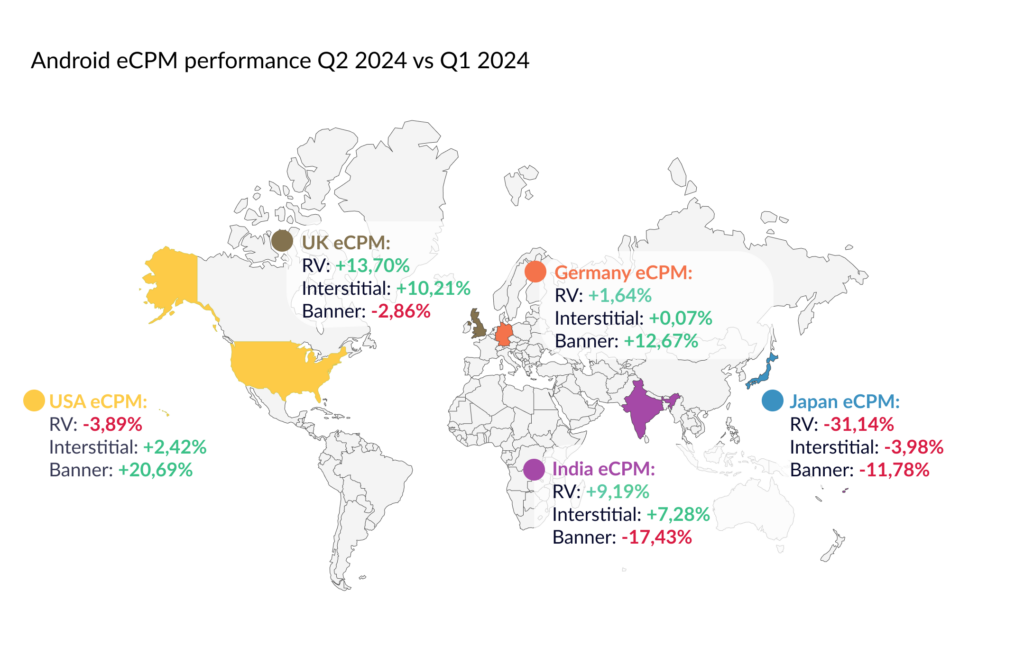
Below, you will find two maps outlining the percentage eCPM changes in mobile app performance across five countries (the USA, UK, Germany, India, and Japan) in Q2 2024 compared to Q1 2024, on Android and iOS, for three ad formats (Rewarded Video, Interstitial, and Banner) drawing from billions of impressions within our network:
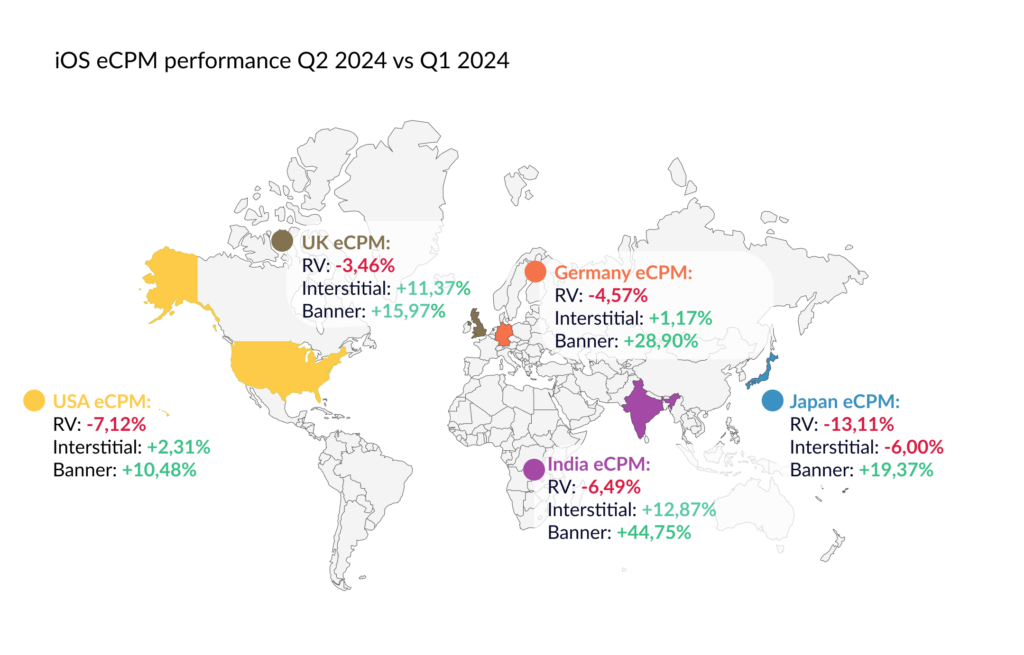
This breakdown indicates a general trend of improvement in average eCPM levels in the year’s second quarter compared to the first. Banner ads on iOS performed exceptionally well across all countries studied, with India seeing the most notable increase, exceeding 44%, mainly due to the strong performance of the AdMob network. Interstitial ads on iOS also showed good performance, except in Japan, where a 6% decline was noted. On iOS, Rewarded Video emerged as the weakest ad format, facing declines in all reviewed countries; however, none was greater than 14%. In four countries, only the RV format saw a drop, except for Japan, which also experienced a decline in Interstitials. Significantly, Japan recorded the steepest drop in this group, surpassing 13%. In other countries, the decreases did not exceed 8%.
When it comes to Android Banner ads, they performed well in only two countries – Germany and the USA. However, this format in the USA recorded the most prominent increase in the Android breakdown – more than 20%. In all countries except Japan, Interstitials recorded growth. RV eCPMs increased in all the countries except for Japan and the USA. You can easily notice that Japan stood out as the worst-performing country in the entire breakdown, and was the only country to experience declines in three ad formats. Additionally, Japan recorded the most significant drop in average eCPM across the study, more than 31%.
eCPM – at the core of monetization
Tracking eCPM metrics shouldn’t be limited to publishers who want to monitor average market values for specific parameters like country, platform, or format. In the realm of app monetization, it is equally important to track and optimize minimum eCPM floors to avoid underselling your bidding units. Monetization partners like Bidlogic play a crucial role by testing, analyzing floor prices, and optimizing the process, allowing publishers to achieve significant growth in Average Revenue Per Daily Active User (ARPDAU).